THERMOS is a program for helping with heat and cooling network design. It incorporates
- A model for estimating heat demand in buildings
- An optimisation model for suggesting good heat networks
- A second optimisation model for suggesting how to set up an energy center for a network
- Tools for processing GIS and OpenStreetMap data into what's needed for network modelling.
These parts are presented through a web interface, so you can use THERMOS without any special setup on your computer.
1. Creating a THERMOS user
To work on THERMOS you need a user account. This keeps your work separate from other people's.
- Go to https://tool.thermos-project.eu/
Enter a username and a password:
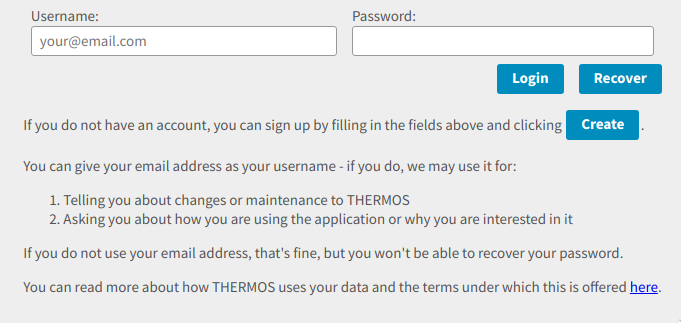
Figure 1: The create account form - note the Create button.
If you use your email address for a username, the system can send you emails for password recovery and so on, so this is advisable.
Click the Create button to create an account
This will log you in and take you to the THERMOS homepage for your user.
(Optional) Change your settings
If you click settings in the top right after logging in you can change your settings:
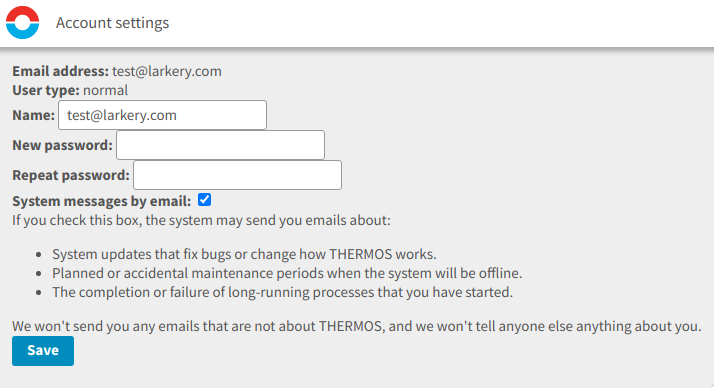
Figure 2: Settings page
Here you can change your display name, which will be shown instead of your login as a nicety, and decide whether you want THERMOS to send you emails.
2. Projects, maps, and networks
THERMOS organises work into a hierarchy:
Projects are the top-level category.
A project is a collection of work which may be made accessible to multiple people.
Projects that you can see are listed on the front page of THERMOS after logging in.
When you make a project you can invite other THERMOS users to work on it, in which case they will be able to see it too.
Within projects are:
Maps: a THERMOS map contains the buildings and potential pipe routes for a geographic area.
The map records estimated heat and cooling demands for the buildings.
Within a map you can create:
- Networks: a network contains a question about a heat network, in which some of the elements from a map are considered for creating a heat network and energy center.
- LIDAR images, which help the THERMOS heat demand model estimate heat demand more effectively.
3. A run through: how to make a project, a map, and a heat network
3.1. Making a project
Once you have logged into THERMOS and made an account you will probably see a front page like this:
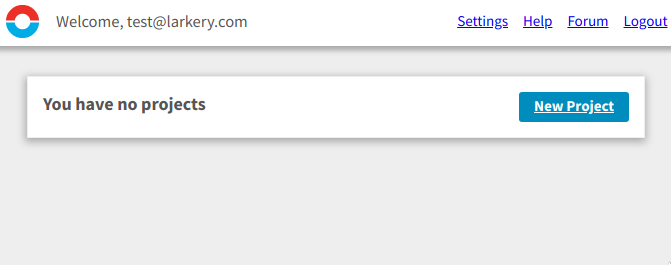
Figure 3: A blank front page for THERMOS, with no projects
Although if someone has invited you to join an existing THERMOS project you might see it listed below.
To get started, click the New Project button, which will show you this:
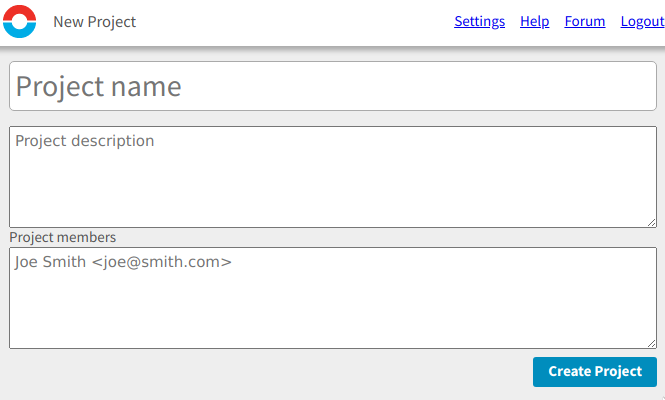
Figure 4: The new project page
In here you need to fill in Project name - you can leave the other fields blank. If you wanted to collaborate with others on the project you could list their email addresses at the bottom.
Once you have entered a project name click Create Project, and THERMOS will take you to the project's home page:
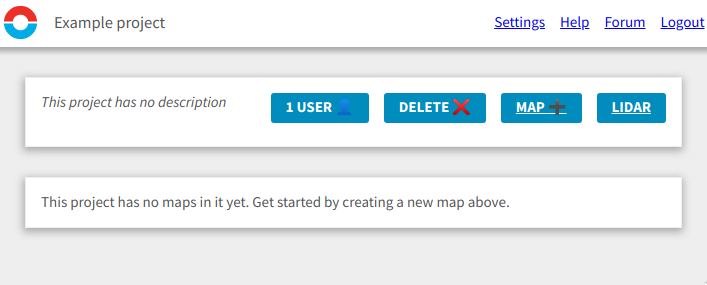
Figure 5: An empty project's home page
The blue buttons across the top let you change things about the project. The one we are interested in is the MAP + button, which lets us create a new map.
3.2. Making a map
Click MAP+ to make a new map, which takes you to the map creation form:
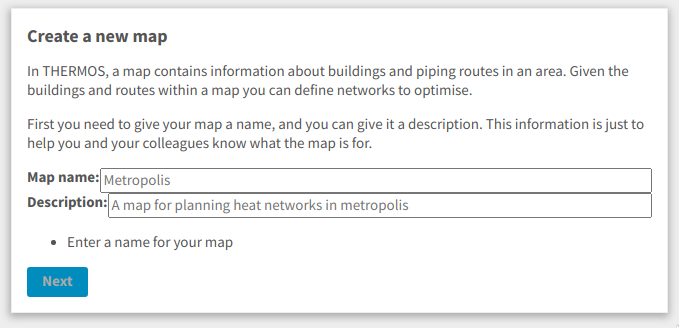
Figure 6: Entering name and description for a new map
As when creating a project, you have to give it a name and you can give it a description. Enter a name and click Next to get to the geometry input page:
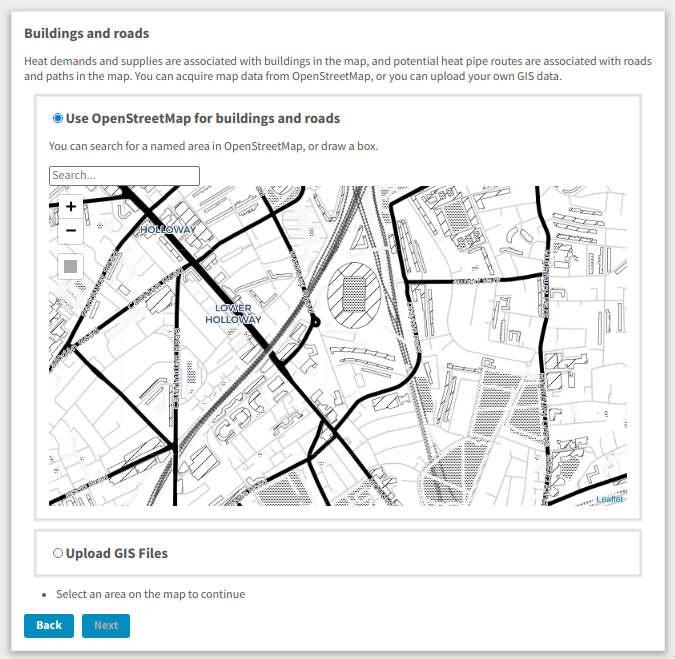
Figure 7: Entering geometry for a new map
On this page you have two choices:
- Use OpenStreetMap data
- Upload your own GIS data
For now we will use option 1 - you can search for a location in OpenStreetMap with the search box, or you can select a rectangular area by clicking on  .
.
Let's draw a rectangle as this is easy to do. Click the rectangle button, click in the map to start drawing, and click again to close the rectangle. You should see it highlighted in blue:
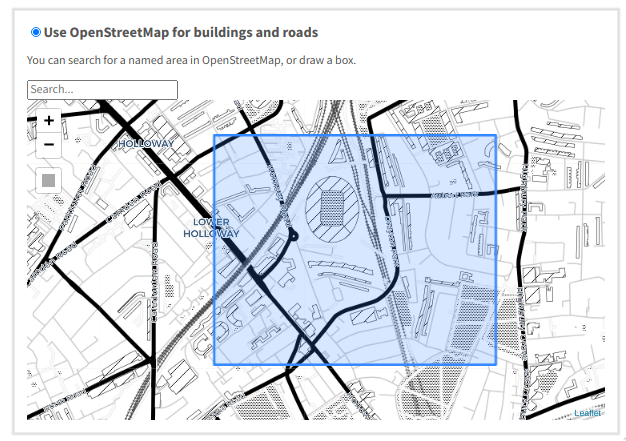
Figure 8: A highlighted area - buildings and roads in this area will be in our map
Clicking Next again will show us about LIDAR coverage:
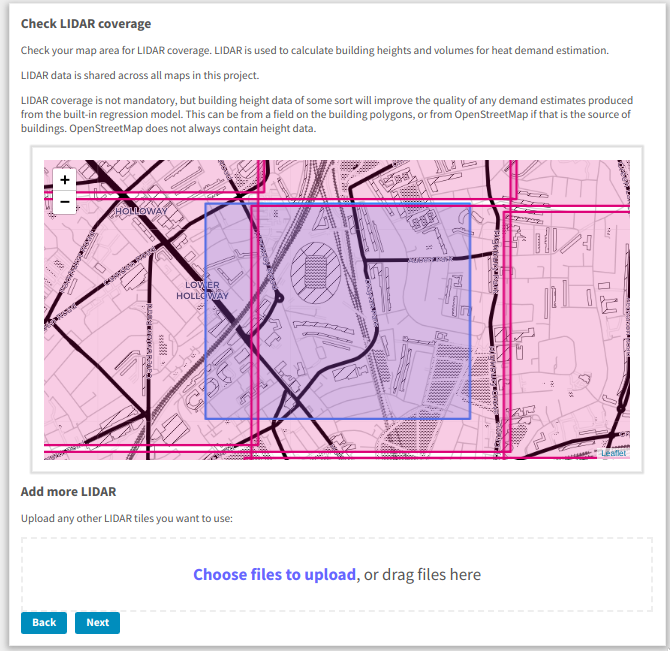
Figure 9: Checking LIDAR coverage in a new map
In this screenshot the THERMOS installation has some built-in LIDAR for the area we are mapping, shown by the pink rectangles on the map. If we had our own LIDAR for the area instead, we could upload it here. For now, let's click Next:
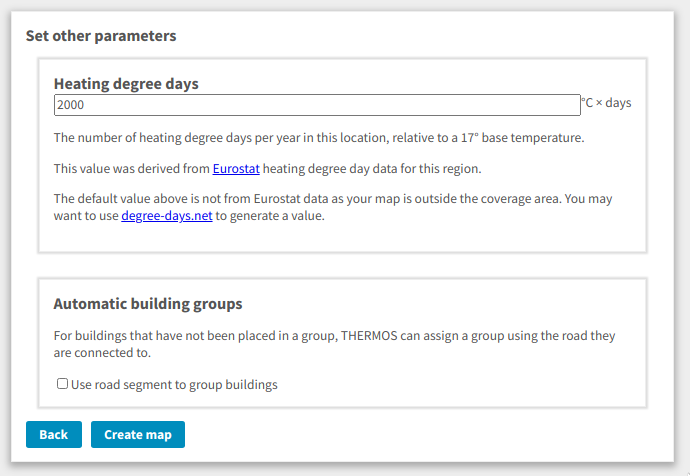
Figure 10: Other settings for a new map
These are the last inputs THERMOS needs to make a map. The Heating degree days will be used to calibrate the heat demand estimates. You should make sure the value here reflects the heating degree days in your area. See, for example, https://degree-days.net/ for data about this.
If you tick Automatic building groups nearby buildings will be combined into groups, which can help make large problems more tractable. Click Create map and THERMOS will start making a map for you:
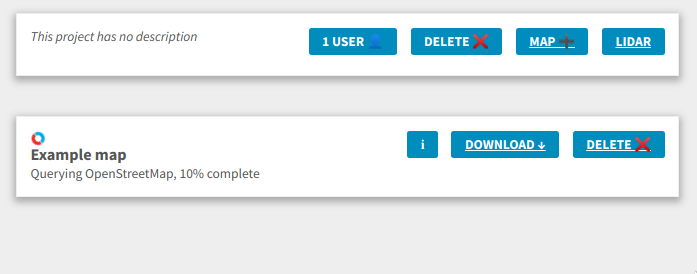
Figure 11: Project page with a map being loaded
THERMOS has returned us to the project page. While the map is being constructed a spinning THERMOS icon will appear on it. Once the map is ready, it will look like this:
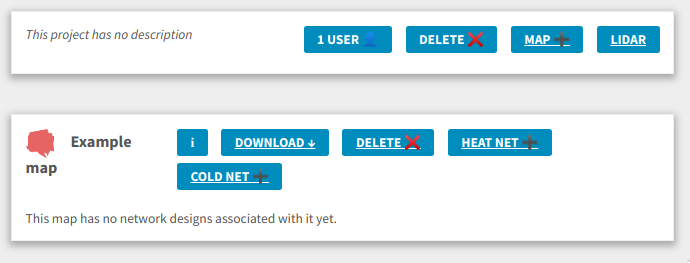
Figure 12: Project with completed map. On the left of the map box is a small icon showing the outline of the geometry in the map. To the right are buttons relevant to this map.
If the project contained more maps, they would be listed below on the project page. Now we are ready to model a heat (or cold) network.
3.3. Making a network
To start making a (heat) network click the HEAT NET+ button on the map. This will show you the heat network editor's main interface, where most action in THERMOS takes place:
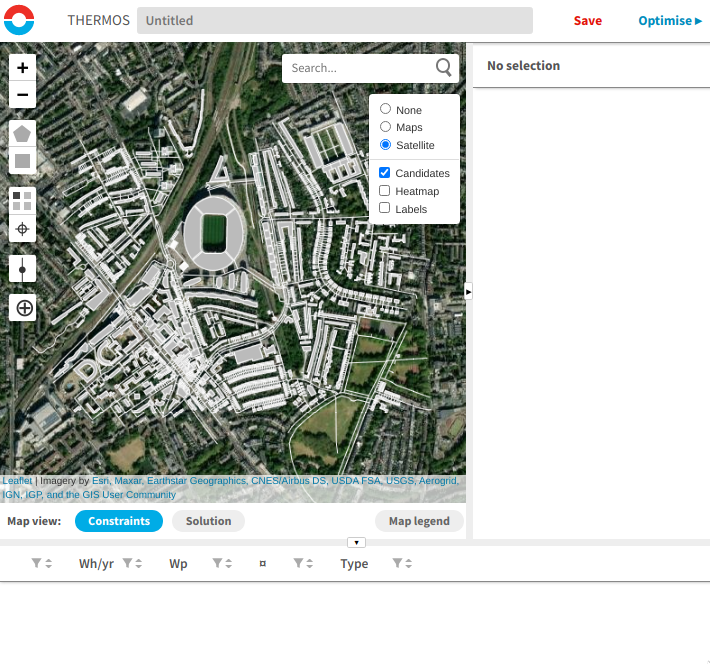
Figure 13: The main page in the heat network editor. On the left is a view of the mapped area, on the right a panel that shows information about the selected items, and at the bottom a panel that lists potential network elements.
The parts of the heat network editor are described in more detail in the network model user interface section. For now we will define a quick problem and run it.
First, zoom in on an area in the map with a few buildings in it. You can zoom in either by using the scroll-wheel on your mouse, if it has one, or by clicking the + and - buttons in the top left.
Now we want to select some buildings and pipe routes. One way to do this is by drawing an area on the map, using these buttons:  . The square button lets you draw a square, like when we were creating a map. Use this to draw a square with some buildings and pipe routes in it:
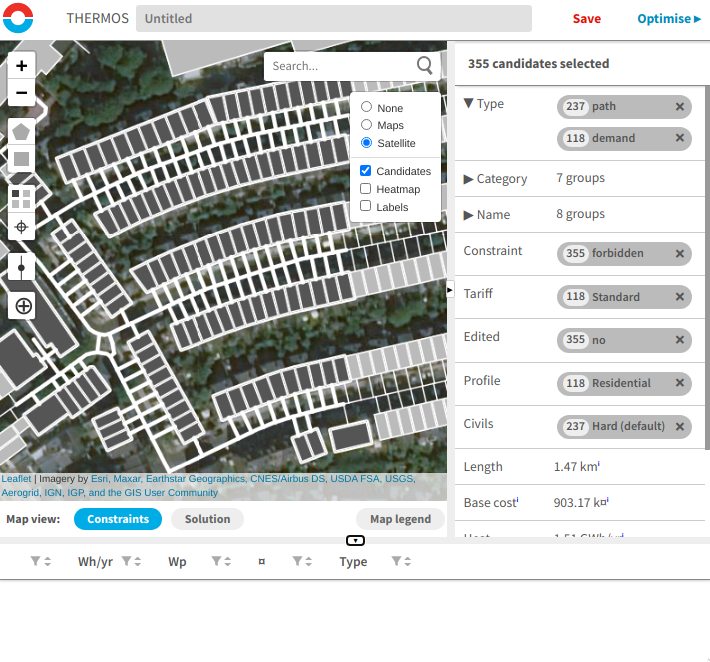
Figure 14: New map with some buildings and pipes selected. The selected items are highlighted on the map, and the panel on the right shows information about them.
Now we have selected some stuff, there is some detail displayed in the selection info panel on the right. This tells you about all the things which are selected, and you can also use it to narrow down your selection.
The important thing in this picture at the moment is the Constraint row on the right: 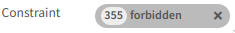 . To start with it says forbidden. This means that the selected items will not being considered for a network - we want to change this so they may be considered. One way to do this is to press the c key; this should change the picture to look like this:
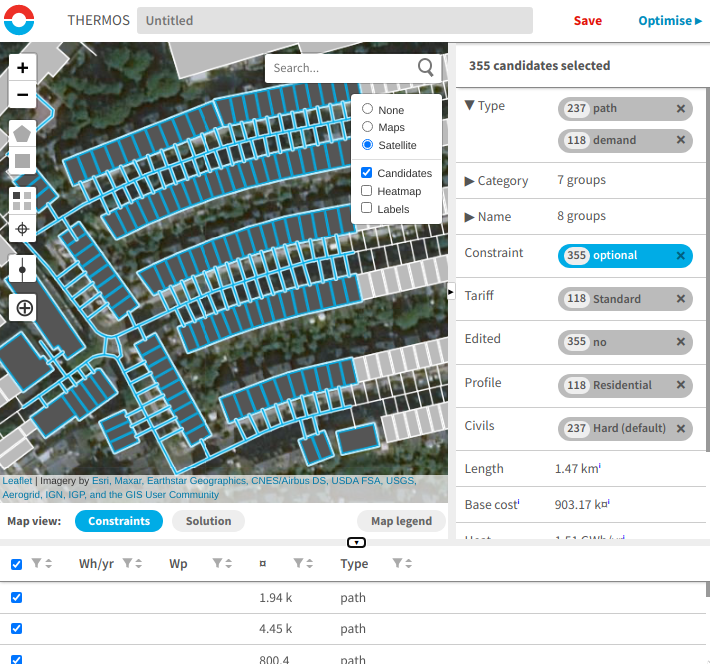
Figure 15: New map with the selection changed to optional. Note that (a) the selected items have turned blue and (b) they have appeared in the list at the bottom of the screen.
You can build up a network problem like this, by selecting things and pressing c to include them for consideration. In this picture the candidates are optional, which means they will be networked if profitable to do so.
Finally, before we can run a problem we need to define a supply location. Select a single building by clicking on it - the selection info panel should display information about that building alone.
Now press s to change the building into a supply:
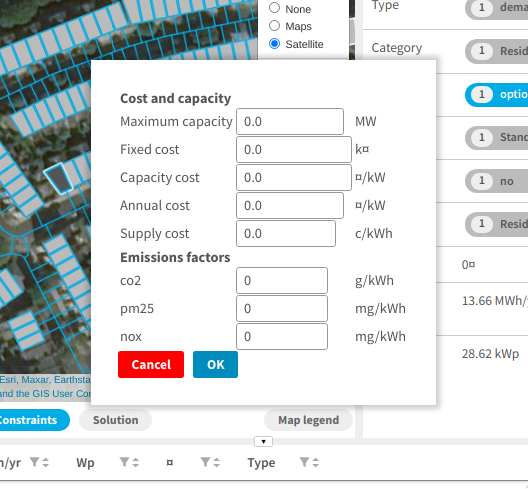
Figure 16: Editing the parameters for a supply location.
The meaning of these fields is explained in more detail elsewhere. For now let's enter something for maximum capacity, like 1MW, and something for the cost of heat under supply cost, like 3c/kWh. Press OK, and you will see the building change colour on the map to show it is a supply point.
Now we can run the model!
3.4. Running the model
First enter a name in the name field at the top of the page. Next click Optimise, in the top right, then click Both. THERMOS will run the network optimiser and then the supply optimiser. While the model is running, a panel will appear showing information about progress. When this is finished, you can change the map to colour-code by solution rather than constraints:
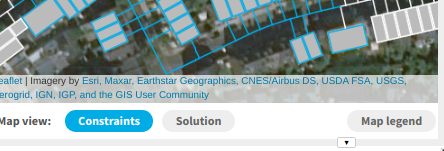
Figure 17: The map view controls - clicking Constraints shows the "question" for the optimiser, and clicking Solution shows the "answer" the optimiser has produced. Click Map legend for a description of what the colours mean.
3.5. Looking at the results
In solution view you can look at the proposed solution on the map:
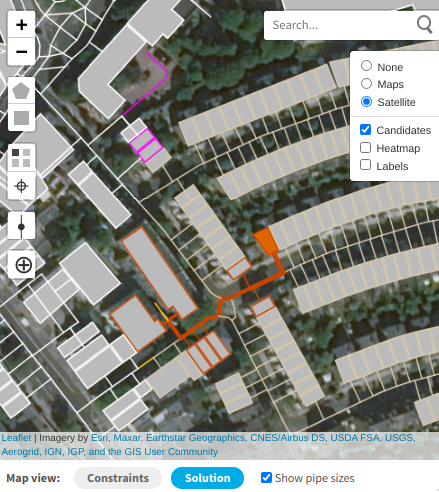
Figure 18: A small network solution displayed on the map. Pipework and buildings in the system are shown in red.
You can also look at a techno-economic summary of the results, visible on another page of the application. Clicking the THERMOS icon in the top left of the page will show a page-selecting menu on the left:
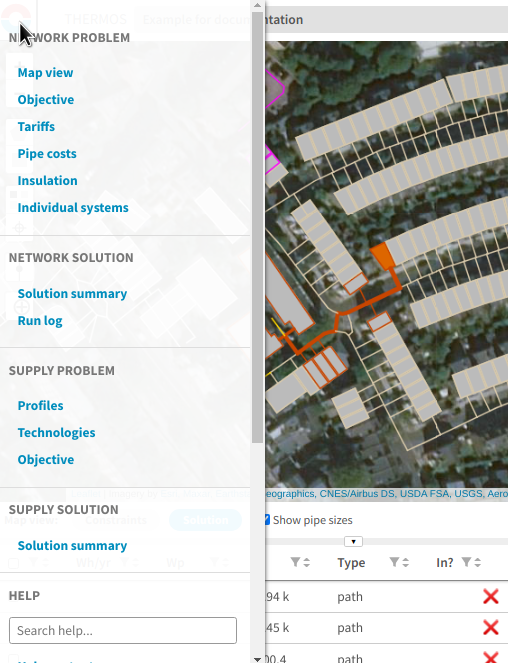
Figure 19: THERMOS sidebar menu
The pages in here are described in more detail elsewhere. To see information about the network model solution click Solution summary under Network solution. To see more informaiton about the supply model solution click Solution summary under Supply solution.
3.6. Downloading outputs
You can download model outputs as GIS or Excel data from the sidebar - scroll down to Import / Export Data for links.