1. The home page
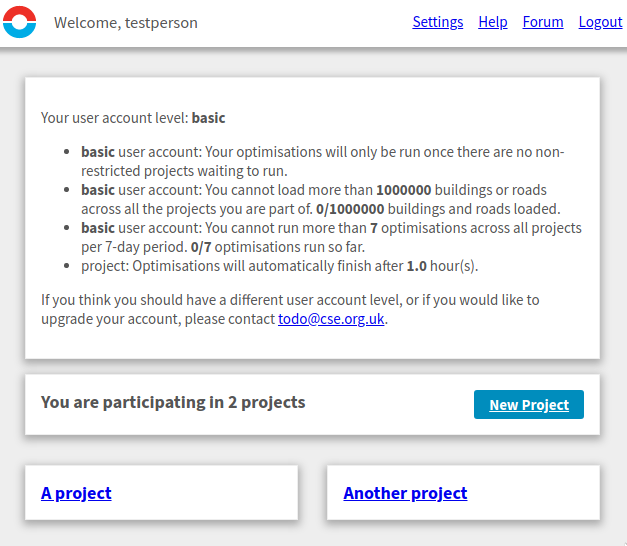
Figure 1: The THERMOS home page, after logging in
The home page does not do very much; the important parts are
- The top bar, containing
- Settings, which will let you change how THERMOS shows your name, change your password, and select whether you want to receive emails from the system
- Help, which you are looking at right now
- Forum, which links to a discussion forum in which you can ask questions
- Logout which is self-explanatory
- A description of your user account level (in some cases), which shows how much of your limited server resources you have used up,
- The button to create a new project, and
- A list of projects underneath, each displayed as a box with a link in it.
2. Project pages
From the home page you can reach the project page for each project, which will look something like this:
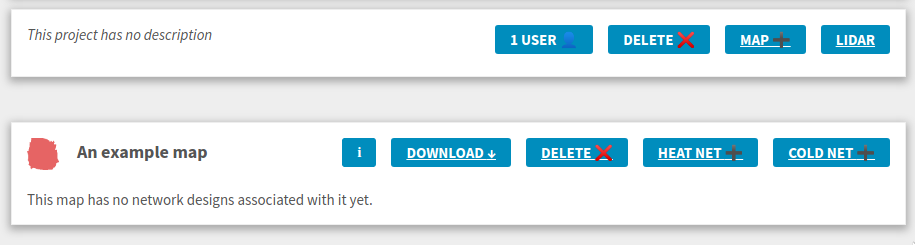
Figure 2: A project page with a map in it
Project pages always have a bar at the top, whose controls pertain to the project:
- N User(s)
- The users button lets you see and perhaps control who has access to the project. More on this below.
- Delete
- This will delete the project entirely.
- Leave
- This will remove you from the project, but not delete it. You will no longer be able to access the project. The button is only displayed if there are other users than you on the project.
- Map +
- This button lets you add a map. More on this below.
- LIDAR
- This lets you add LIDAR to the project, which will make better maps. More on this below too.
Some of these controls will not be shown if you do not have permission to change the project.
3. Changing user access to projects
If you click on the users button on a project page you can change who can view a project. However you must be the project admin to do this. Whoever creates a project is an admin for that project, and any admin can make any other user an admin.
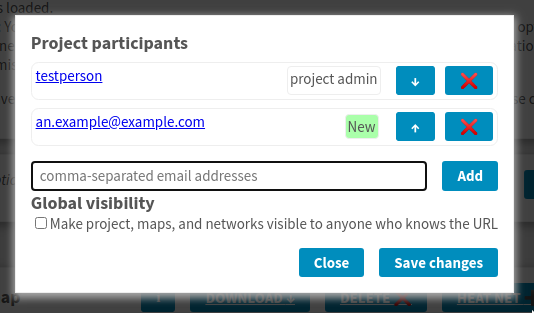
Figure 3: Project participants box.
In the project participants box you can add, remove, promote and demote users on the project. The ↑ and ↓ buttons promote a user to or from being a project admin. The red cross button will remove a user, and the add button will add users whose usernames / email addresses are listed in the box on the left.
Finally at the bottom is a tickbox to make a project globally visible. If you tick this box, then you can share the URL for the project with anyone and they will be able to see the maps and networks it contains (whether or not they have a login on the THERMOS system).
People who don't know the URL will not be able to see the project, but URLs are not hard to guess as they contain sequentially generated numbers, so you should not rely on this to secure any important data.
4. Creating maps
You can create a map from OpenStreetMap data, or from your own GIS data.
Once a map is created, its contents are fixed and will not change.
You can modify things from the map within the network editor, but this change is only in the network problem you have created, not in the underlying map.
To start making a map click Map + on the project page. This will take you to a step-by-step process for map creation.
The first page is just for a name and description, but it's useful to show a picture as it illustrates something else:
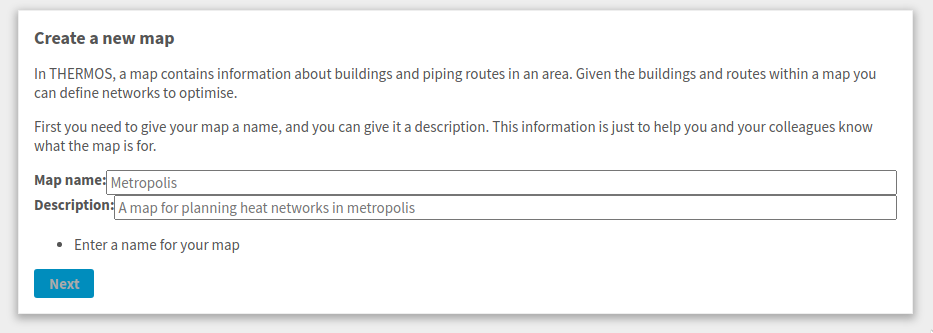
Figure 4: Entering the name and description for a map - at the bottom you can see that the Next button is "greyed out" so you can't proceed. The problem is displayed above; you must enter a name for your map.
4.1. Spatial data
After the name page you must acquire spatial data for the map. There are two options here:
- Use OpenStreetMap (OSM)
- Upload your own GIS files
4.2. Using OpenStreetMap
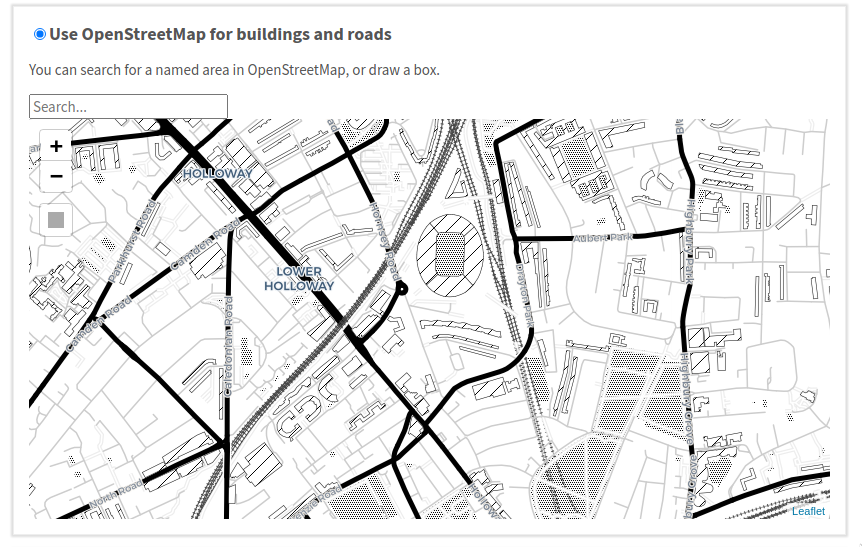
Figure 5: Creating a map from OSM. Use the search box or controls on the left to select an area to load the map from.
Using OSM is easiest, but you are restricted by how well mapped the area you're interested in is. Some OSM tags (the OSM term for data fields) are used when loading data:
landusebuildingandamenitytags are used to populate THERMOS' category field- the
heightandbuilding:levelstags are used as inputs to the demand model, if LIDAR is not available - the
namefield is used to populate THERMOS' name field. This is often a street or building name.
The application will only let you load a certain area from OSM at once. If the area you have selected is too large, you won't be able to continue to the next step.
4.3. Using GIS data
If you have your own GIS data you can upload that instead of using OSM.
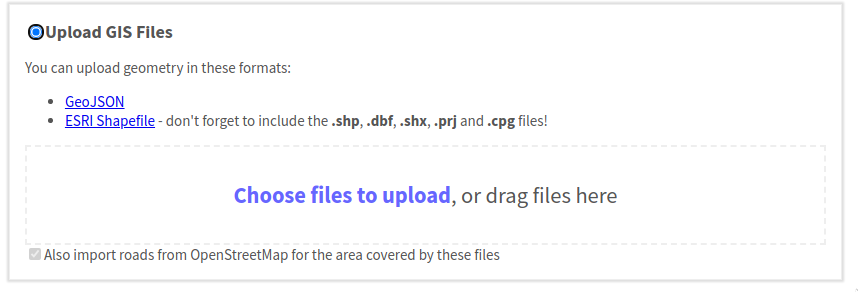
Figure 6: Uploading GIS data.
You can do this by dragging and dropping data in one of the supported formats into the dotted rectangle. When you do this a progress bar will be shown for each file as it is uploaded. Once they are uploaded and each row is green, you can continue. All the geometry GIS files you upload will be added into the map.
If the GIS files contain linestring or multilinestring data, these geometries will be used for potential pipe routes. All other geometries will be assumed to be buildings.
If you have no linestring or multilinestring data, the box to Also import roads from OpenStreetMap will be checked; in this case OSM is queried for roads and footpaths in the same area to use for pipe routes. Otherwise, the box will be unchecked, but you can check it yourself if you want to use OSM paths as well as what is in your GIS data.
4.4. Using fields in GIS data
Your GIS data may contain other fields than just geometry. Some of these may have special meaning that THERMOS could make use of, and you might also want to keep some to view in the network editor.
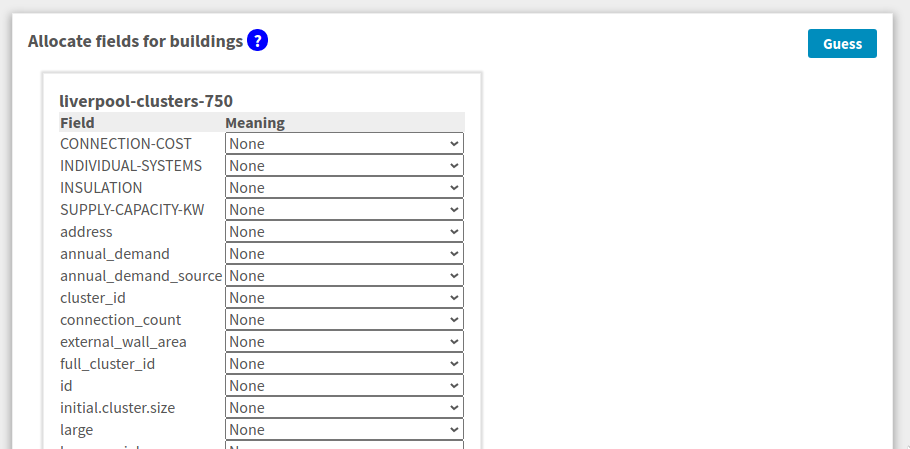
Figure 7: Building field allocation. On the left is the name of a field (AKA attribute) in the GIS file, and on the right is the meaning THERMOS should use for the field. Clicking the question mark button at the top will give an explanation of each meaning.
This is made possible on the next page after uploading GIS data, which will show a list of each field in each input GIS file, and allow you to instruct THERMOS about what the field means.
4.5. Field meanings
The meaning choices for buildings have these effects:
- Annual heat demand (kWh/yr)
- A value for annual demand will be used in preference to any other estimate. Otherwise, a benchmark estimate will be used if available, or the built-in regression model otherwise.
- Max. heat demand (kWh/yr)
- An upper bound to apply to the modelled annual heat demand. If the demand estimation model is used, and it produces an annual demand above this value, this value will be used instead.
- Min. heat demand (kWh/yr)
- A lower bound to apply to the modelled annual heat demand. If the demand estimation model is used, and it produces an annual demand below this value, this value will be used instead.
- Annual cooling demand (kWh/yr)
- A value for annual cooling demand will be used in preference to a cooling estimate.
- Peak cooling demand (kW)
- A value for peak cooling demand will be used in preference to an estimate.
- Peak heat demand (kW)
- A value for peak demand will be used in preference to any other estimate. Otherwise, the peak/base ratio will be applied to the demand if available, or the - build in regression model otherwise.
- Building height (m)
- A value for building height will be used in preference to any LIDAR data on the server.
Building height will improve the quality of any demand estimates produced from the built-in regression model.
- Fallback building height (m)
- A value for building height to be used if LIDAR data on the server and the building height field are missing.
- Floor area (m2)
- A value for floor area will be used in benchmark-based estimates. If no value is provided, a value will be estimated from the building geometry and height (if known).
- Heat benchmark (kWh/yr)
- A constant benchmark - this is used in combination with the variable benchmark term. If a building has associated benchmarks and no specified demand, demand will be estimated as this constant plus floor area times the variable benchmark.
- Heat benchmark (kWh/m2/yr)
- A variable benchmark per floor area.
- Cooling benchmark (kWh/yr)
- A constant benchmark - this is used in combination with the variable benchmark term. If a building has associated benchmarks and no specified demand, demand will be estimated as this constant plus floor area times the variable benchmark.
- Cooling benchmark (kWh/m2/yr)
- A variable benchmark per floor area.
- Peak/base ratio
- If present, and no peak demand value is known, the peak demand will be estimated as the annual demand (converted into kW) multiplied with this factor.
Otherwise, a built in regression will be used.
- Connection count
- The number of end-user connections the building contains. This affects only the application of diversity curves within the model.
- Identity (text)
- An identifier - these are stored on the buildings in the database and visible in downloaded GIS files.
- User-defined field (any)
- Any other field you want to keep, like a classification, address, etc.
- Residential (logical)
- A logical value, represented either as a boolean column, or the text values yes, no, true, false, 1 or 0. If available, this will improve the quality of built-in regression model results. Otherwise, this is assumed to be true.
- Building group (any value)
- Any buildings which have the same value in this field (except null or an empty string) will be grouped together. Buildings in a group must all be connected to a network at once, or not at all.
For paths the meanings are just for Identity and User-defined field.
The Guess button in the top right will give fields meanings based on the field name.
This is done by taking the field name, lowercasing it, replacing any series of non-alphanumeric characters with a single hyphen, and then using the following table to choose a meaning:
| Normalized name | Guessed meaning |
|---|---|
| annual-demand | Annual heat demand (kWh/yr) |
| maximum-annual-demand | Max. heat demand (kWh/yr) |
| minimum-annual-demand | Min. heat demand (kWh/yr) |
| annual-cooling-demand | Annual cooling demand (kWh/yr) |
| cooling-peak | Peak cooling demand (kW) |
| peak-demand | Peak heat demand (kW) |
| height | Building height (m) |
| fallback-height | Fallback building height (m) |
| floor-area | Floor area (m2) |
| benchmark-c | Heat benchmark (kWh/yr) |
| benchmark-m | Heat benchmark (kWh/m2/yr) |
| cooling-benchmark-c | Cooling benchmark (kWh/yr) |
| cooling-benchmark-m | Cooling benchmark (kWh/m2/yr) |
| peak-base-ratio | Peak/base ratio |
| connection-count | Connection count |
| identity | Identity (text) |
| residential | Residential (logical) |
| group | Building group (any value) |
If you press the Guess button with the control key help down on the keyboard, every non-matched field will be passed through as a user-defined field.
4.6. Check LIDAR coverage
When creating a map from OSM or GIS data THERMOS will use any LIDAR information it has to try and determine building size. This will improve the quality of the model's heat demand estimates.
THERMOS takes LIDAR from two places
- A list of LIDAR files associated with the project
- A list of LIDAR files that are available for all projects
After uploading map data you will see a section like this:
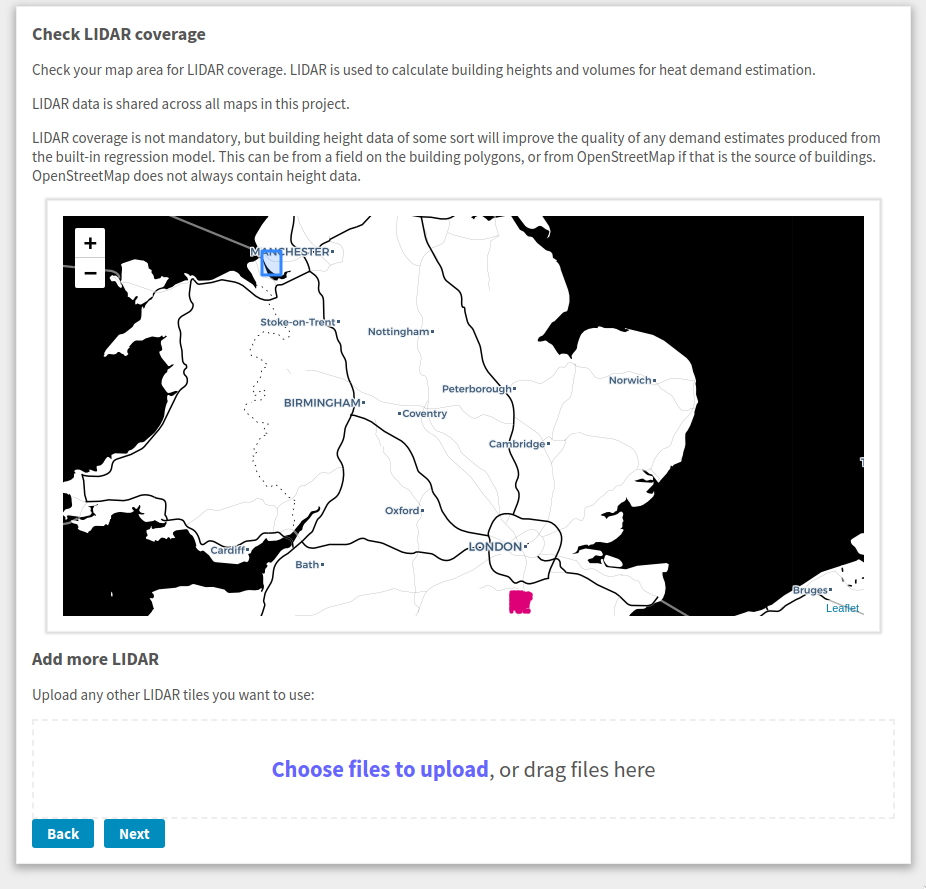
Figure 8: Checking LIDAR coverage. We have uploaded data in the blue rectangle in the top left. Unfortunately the LIDAR coverage in the system is in the pink area in the bottom right, so the demand estimates will be poor unless we upload some LIDAR for the area we are using.
The map shows where the map is to cover in blue, any project-specific LIDAR areas in green, and any other LIDAR In pink.
At this stage if you have some LIDAR that covers the area you are mapping and it isn't already covered, uploading that LIDAR will help THERMOS' demand model with its estimates.
4.7. Other parameters
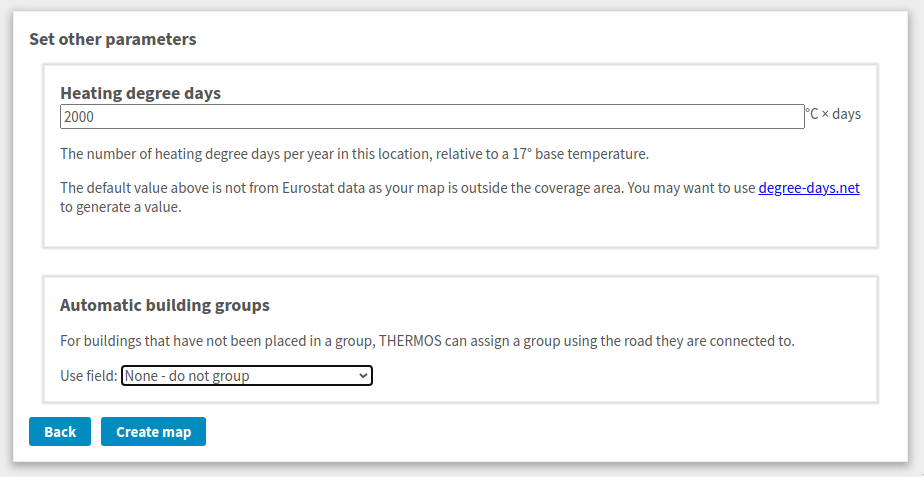 Once you have checked and uploaded any LIDAR, you're nearly there. You will see a section like the above, in which you can enter a heating degree days number to calibrate the demand model, and choose whether to set up some initial building groups.
4.7.1. Heating degree days
The THERMOS demand model bases its predictions on building size and shape, but these need to be calibrated geographically using heating degree days (HDD) for the area. THERMOS will try and estimate an HDD value using data from Eurostat (more details here) if it can. Otherwise you will need to find your own value.
4.7.2. Automatic building groups
The THERMOS network can put buildings into groups. Either every building in a group gets connected or none does. You can create and change groups yourself using the network editor.
The option here lets you set them up automatically in the map by the path they are connected to. You can either group by road segment, or (if using GIS data) any field that is on the paths. Grouping by road segment will make all buildings which get connected to the same segment of road belong to the same group. A segment of road is any section which does not have a junction in it with another road.
Grouping by another field simply groups together all buildings for which their connected road has the same value in the given field.
5. Uploading LIDAR to projects
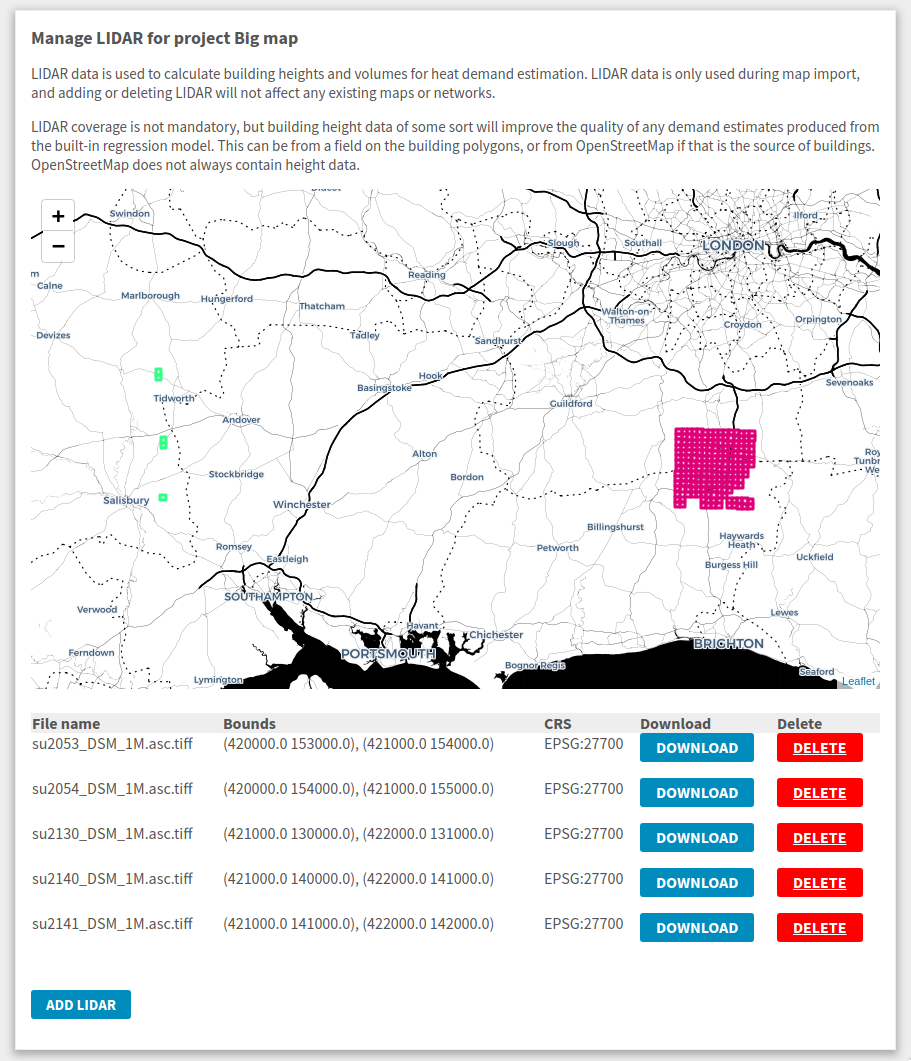
Figure 9: The LIDAR management page for a project. Green squares on the map are the tiles listed beneath the map. Pink squares are built-in LIDAR on the server, which appear in every project.
By clicking the LIDAR button on a project page, you reach the project's LIDAR management page. This is another way to manage the LIDAR data associated with a project, similar to the LIDAR screen in the map creation process.
Any LIDAR data you add on this page will be used when running demand estimates for newly created maps (old maps are not affected by adding new LIDAR).
6. Managing saves
Each time you save or run the model a new network problem is saved on the server. These problems do not replace one another, so old saves are still available.
Normally maps are displayed on the project page like this:
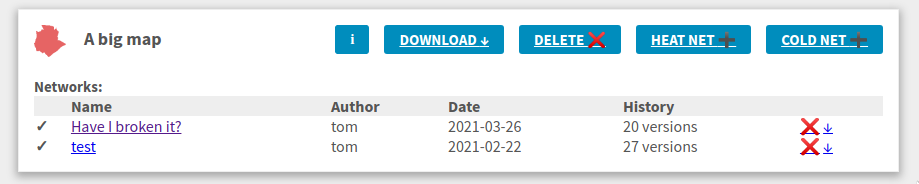
Figure 10: An example of how a map looks on the project page by default. Although there are only two networks shown here, the history column indicates that more saves exist.
Each row shows the status of the most recent network problem that has a given name within this map. On the rows you can see a few indicators
On the left the run status is shown.
A tick means that this specific save has been optimised, a spinning THERMOS icon shows it's running, and anything else indicates that save has not been run. If it contains a solution, the solution is from a previous save.
When the spinning icon is shown, you can click on it to cancel the job before it has finished.
- The Name is what is used to relate versions together
- The Author is the username of the person who saved the latest version
- The Date is when the save was made
- The History cell shows how many previous versions there are with the same name
- The red cross deletes this network and its history
- The down arrow downloads the latest version of this network as GeoJSON for GIS use.
However, if you click on the value in the History column for a given row the view will change:
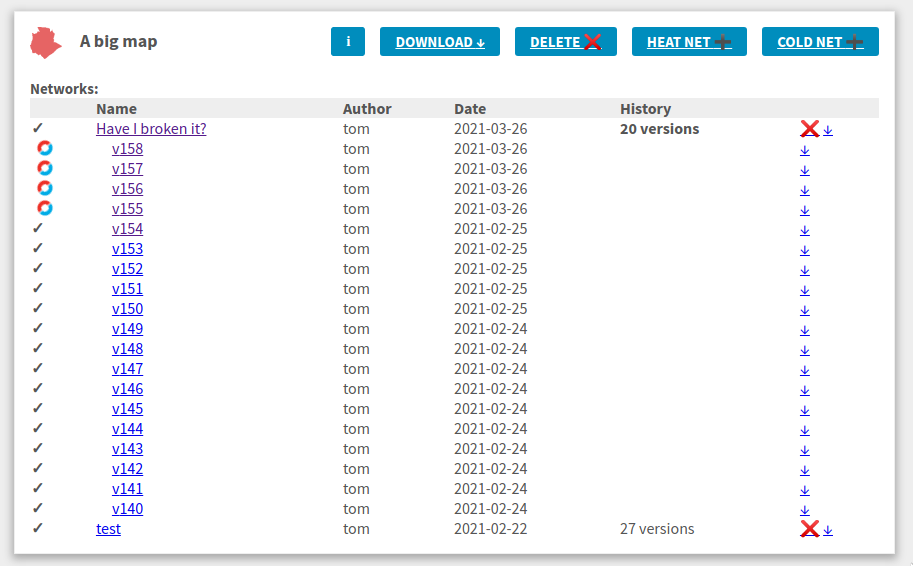
Figure 11: Viewing the history of a network in a map. Note how there are several old versions of the network problem still running, and you can view or download the older versions by clicking on the links in their rows.
Each previous save for the given name is shown beneath it, somewhat indented. Clicking on the links (which will have a label like v1234) for previous saves will let you look at them in the editor.